
The 2025 Holiday Shopping Survey: AI, Social Media and BNPL
For the sixth year in a row, Applause conducted a survey to understand holiday shoppers’ plans and preferences, and identify trends. This year, we also asked people who work in software development, QA, or product management about their organizations’ payment and localization offerings, along with how they are incorporating AI into the customer experience. See where expectations and reality align, and where businesses may need to adjust to better serve their customers.
Shoppers plan to increase spending…
Almost all the shoppers surveyed plan to shop both in-store and online: of more than 3,260 respondents, 92.2% plan to shop online and 90.2% plan to shop in physical stores. Many plan to increase spending over last year as well — 41.3% plan to spend more online and 35.5% plan to spend more in-store than last year. About 38% plan to keep both online and in-store spending about the same as last year.
…but many plan to return gifts or spread out payments
While 16.7% of shoppers say they would never return a purchase or gift, 32.6% say they are likely to do so (n=2,995). Only 28.3% of 392 technology professionals who responded stated that their organizations test returns, leaving the door open for friction and flaws during the return process.
Purchases using buy now, pay later (BNPL) could also impact holiday revenue figures — 20.5% of 2,943 shoppers report that they use BNPL for online purchases, and 78% of those shoppers intend to use BNPL this holiday season. While 17.2% of 465 respondents say they do not have a preferred BNPL provider, those that do typically opt for PayPal (27.3%), Klarna (18.1%) or Affirm (11%). Interest rates and fee structures are the most important factors in a BNPL provider according to 43.1% of consumers, ahead of repayment timeline (36%), credit limit (14.7%) and refund policies (6.3%).
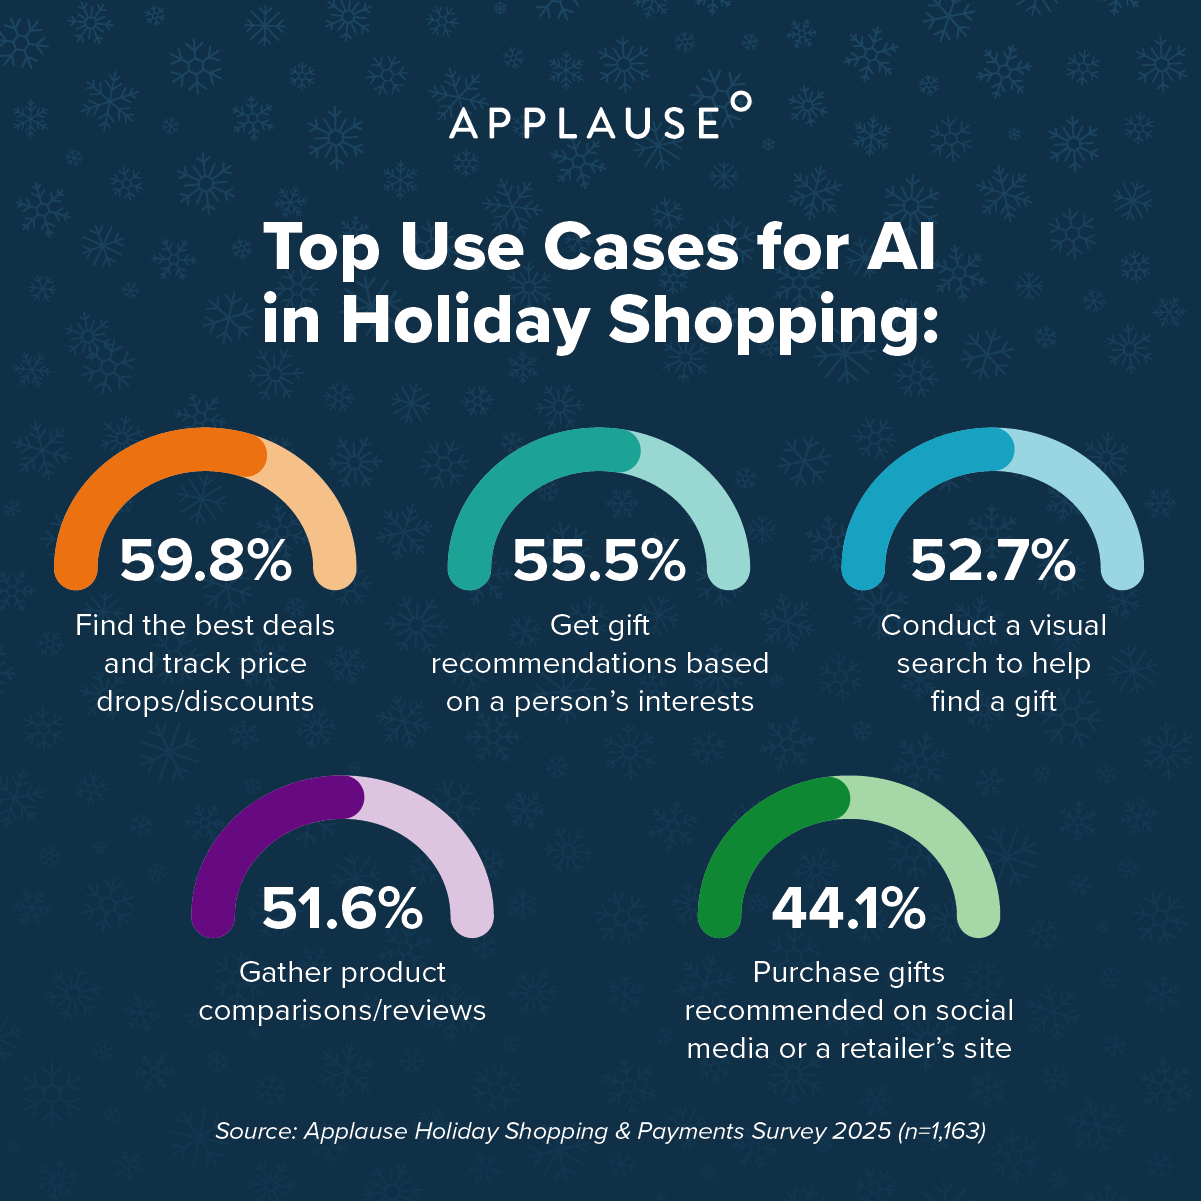
AI is making its way into the process
While some people cherish the ritual of holiday shopping — making a list and checking it twice — not everyone shares that sentiment. In fact, 38.4% of more than 3,000 respondents plan to use AI to help with their holiday shopping this year and another 32.4% have not ruled out the possibility.
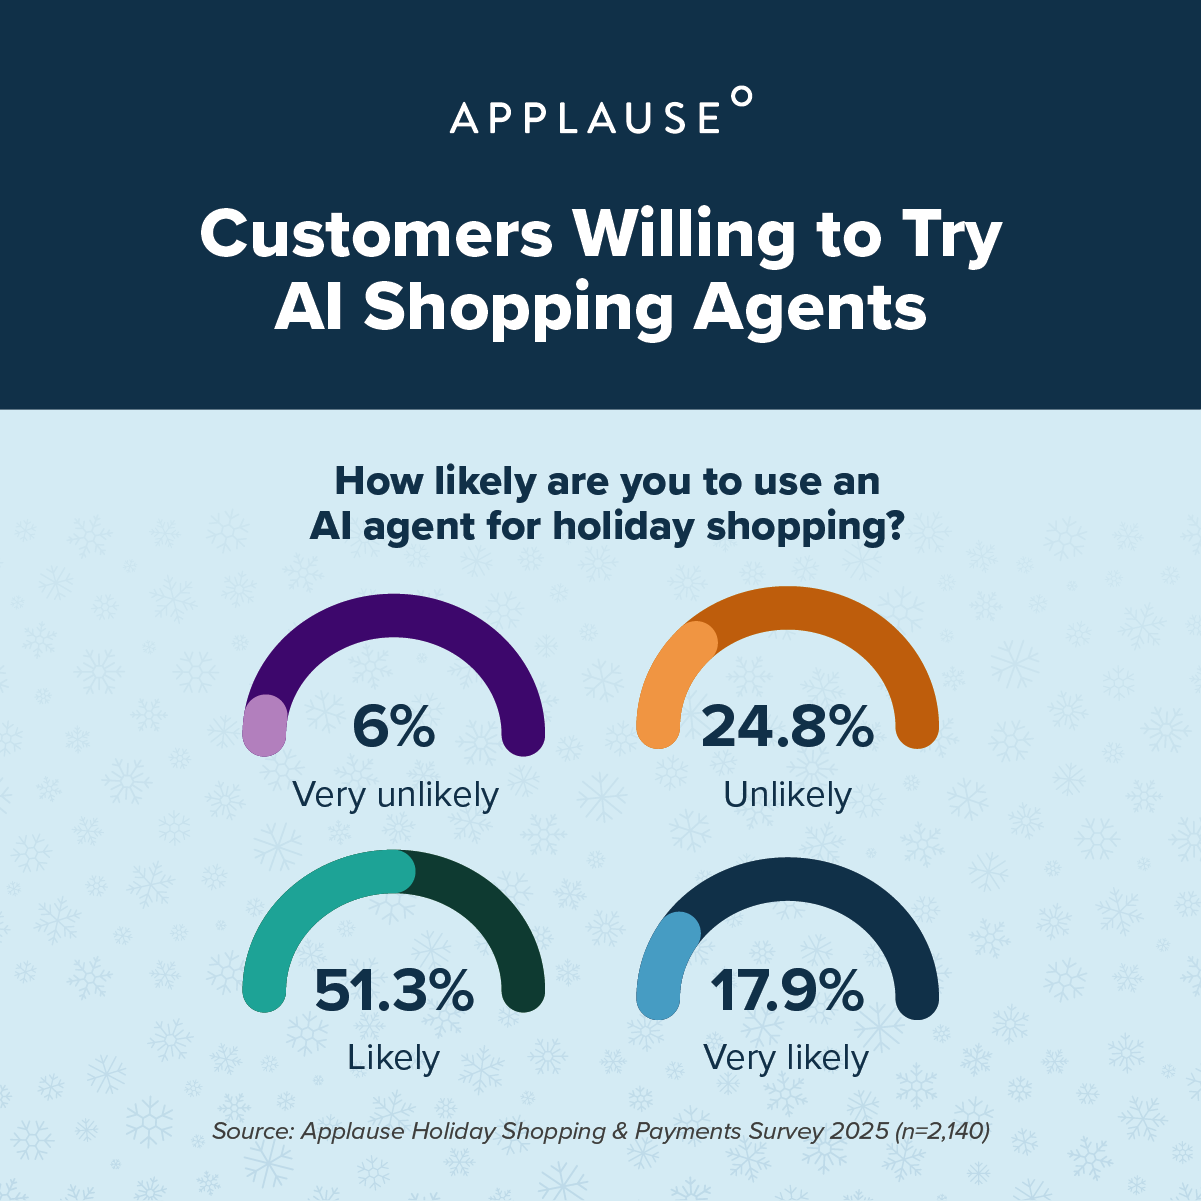
Despite the lack of widespread availability, a surprising majority of respondents (69.2%) indicated that they’d be willing to turn shopping over to AI agents:
Given this interest, it’s no surprise that 49.6% of the 405 technology professionals who responded said their organization is working on some form of AI shopping/purchasing agent — 17.5% are joining a partnership such as OpenAI Instant Checkout or Microsoft’s Copilot Merchant program while the other 32.2% are developing tools in-house.
The majority developing AI shopping and purchasing functionality come from three industries:
- B2B Tech: 27.8%
- FinTech: 20.5%
- Retail/Ecommerce: 17.6%
Shopping through social media is becoming more common
Brands must think beyond their own websites and apps. Though 53.5% of more than 2,800 consumers said they prefer to shop through mobile apps, 56.5% said they are likely to shop through social media platforms this holiday season.
The most popular shopping channels:
- Instagram: 67.9%
- Facebook: 63.4%
- TikTok: 52.8%
(n=1,604)
Payment methods are also evolving
While many consumers use a variety of payment options online, they aren’t always happy with the choices available — 41% say they’re extremely likely to abandon a purchase if a website or app doesn’t accept their preferred payment method. Most prefer to use credit cards (31.4%), with debit cards (30.1%) and mobile/digital wallets (24.3%) rounding out the top three most popular payment methods. Over the last year, 40.2% of consumers say they’ve started using a new payment method. A new mobile/digital wallet was the most common option (54.1%).
Most organizations — 80.5% — reported that they accept credit and debit cards through their apps, and 57.7% accept mobile/digital wallets. Only 15.1% offer BNPL. Perhaps those numbers will increase soon, as 60.3% of software pros stated that customer preferences help determine which payment methods they accept.
Shoppers will rely heavily on omnichannel options to make shopping easier
To keep the element of surprise alive (and avoid porch pirates) many shoppers plan to pick up their orders rather than having them shipped to their homes. Omnichannel options they plan to use:
- Buy online, pick up in store (BOPIS): 78%
- Delivery lockers/parcel lockers: 41.2%
- Curbside pickup: 40.8%
Those pickups need to flow smoothly, as 50.5% of shoppers say they are likely to leave a brand that has a poor omnichannel experience.
Consumers expect intuitive, friction-free shopping
Businesses need to make sure that all shopping flows work right the first time: 49.9% of shoppers will only try a purchase twice before abandoning their cart if they encounter an issue. And, 30.3% will abandon an online purchase if they encounter a bug at any point in the process, while 30.1% will quit if they encounter a bug at checkout.
Many organizations fall short when it comes to testing all aspects of payments. While 71.7% say they test purchase transactions, less than a third test or evaluate other common types of transactions and elements of the purchase process. Some aspects of the process that respondents reported testing include:
- Purchase confirmations and receipts contain correct info: 32.1%
- Checkout processes are accessible: 30.4%
- Exchanges: 28.8%
- Returns: 28.3%
- Calculations for taxes/shipping: 23%
- Error messaging/guidance for failed transactions: 22.7%
- Recurring subscriptions/automatic renewals: 22.2%
Organizations that go to market in multiple countries and regions recognize there are often differences between markets: 68% say their company’s websites and apps are available in multiple languages and 66.7% adjust customer journey/checkout flows to align with norms in different countries and cultures.
Webinar
Navigating the Regional Payment Frontier
Unveil the power of local payment methods, which are on the rise globally. This webinar details regional trends, integration challenges and strategic solutions for optimizing digital transactions.